As your agency grows and takes on more clients, the process of preparing reports for marketing performance becomes more demanding. Phone calls are often one of the strongest lead indicators, so having a structured and repeatable method to produce a call tracking metrics report is essential for proving ROI and understanding which marketing channels drive results.
This guide explains how to build a call tracking metrics report using several methods, including native Nimbata tools, Google Looker Studio, Google Sheets, Zapier, and hybrid setups. It also covers the call tracking metrics you should include, how to analyze your data, and how to build reporting dashboards that clients can understand easily.
Why call tracking metrics reporting is mandatory
Phone calls remain a high intent conversion action for many industries. A strong call tracking metrics report helps you understand:
- Which marketing campaigns drive phone leads
- How many calls convert into real opportunities
- When call activity peaks
- How callers behave
- How effectively calls are handled
- Where missed opportunities occur
When call tracking metrics reporting is done correctly, it gives you and your clients a clear view of marketing influence, operational performance, and lead quality.
5 methods to build a call tracking metrics report
Below are five methods you can use to generate call tracking metrics reporting, ranging from native call tracking dashboards to manual spreadsheet analysis. Each method is based strictly on your original content combined with verified Nimbata information.
Method 1: Use Nimbata’s built-in reporting tools
Nimbata provides multiple built-in reporting features that help you create call tracking metrics reports without relying on external tools.
Key features that support reporting
- Session to phone tracking which links each call to the exact channel, campaign, landing page or keyword that influenced it
- Call tagging and call outcome tracking to categorize calls as leads, missed opportunities, spam, voicemail or other outcomes
- Call recording and transcription to help evaluate call quality, customer intent and qualification
- Customizable dashboards which allow you to choose the exact charts and tables you want for each client
- White labeling to brand dashboards with your agency’s logo, colors and wording
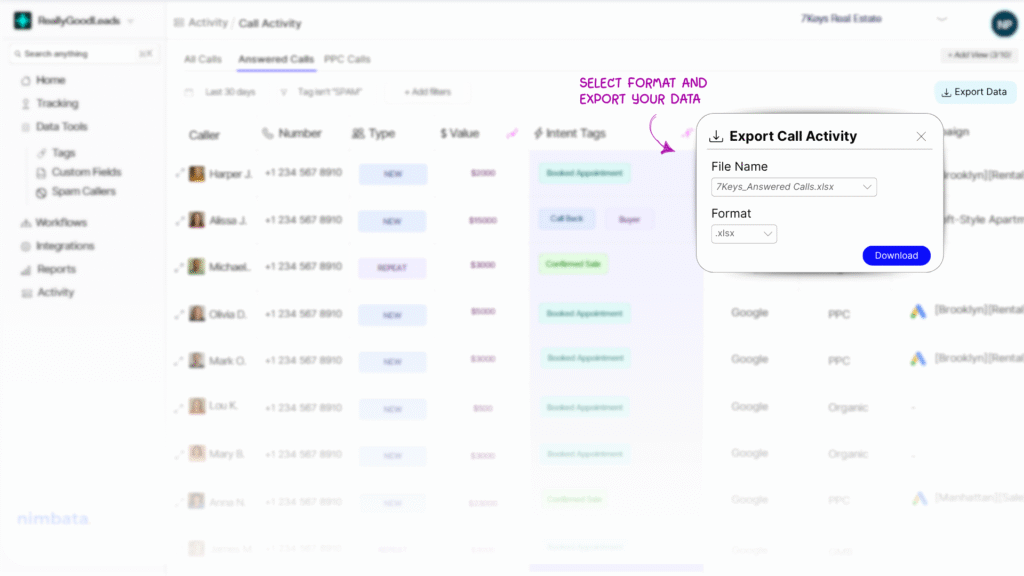
- Report exporting which lets you export dashboards as PDF, into Excel or CSV, or send call data directly to Google Sheets
When this method is ideal
- You want ready-to-use dashboards
- You need white label client reports
- You prefer a reporting environment designed specifically for call tracking
- You want accurate attribution from session to phone tracking
This method is the most complete and requires the least manual work.
Tip: The Call Tracking Dashboard can be white-labelled, branded with your logos, brand colors and wording, making it the ideal dashboard to share with your clients and prove your work.
Method 2: Send call tracking metrics to GA4 and visualize in Looker Studio
Google Looker Studio is a popular method for creating dashboards. To use it for call tracking:
- You must first send call events to Google Analytics 4 from your call tracking platform.
- When selecting the data source in Looker Studio, you must ensure that you send all necessary call information into GA4.
- Once the data is flowing, it is easy to build charts, filters and tables.
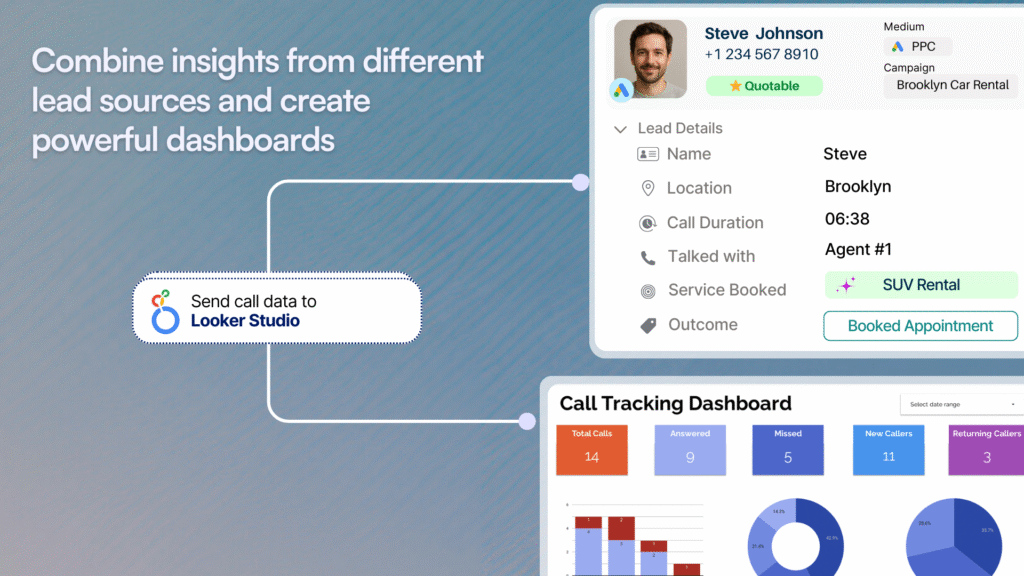
Best practices for Looker Studio call reports
- Keep the dashboard focused on the KPIs that matter most
- Use filters for date range, source, campaign or device
- Choose appropriate chart types such as time series, bar charts or scorecards
- Avoid overloading the dashboard with too many visual elements
This is a strong option when your team or clients are already familiar with Looker Studio, or if you want a single view combining web and call performance
For a detailed Google Looker Studio tutorial on how to create a new report, check out their official documentation.
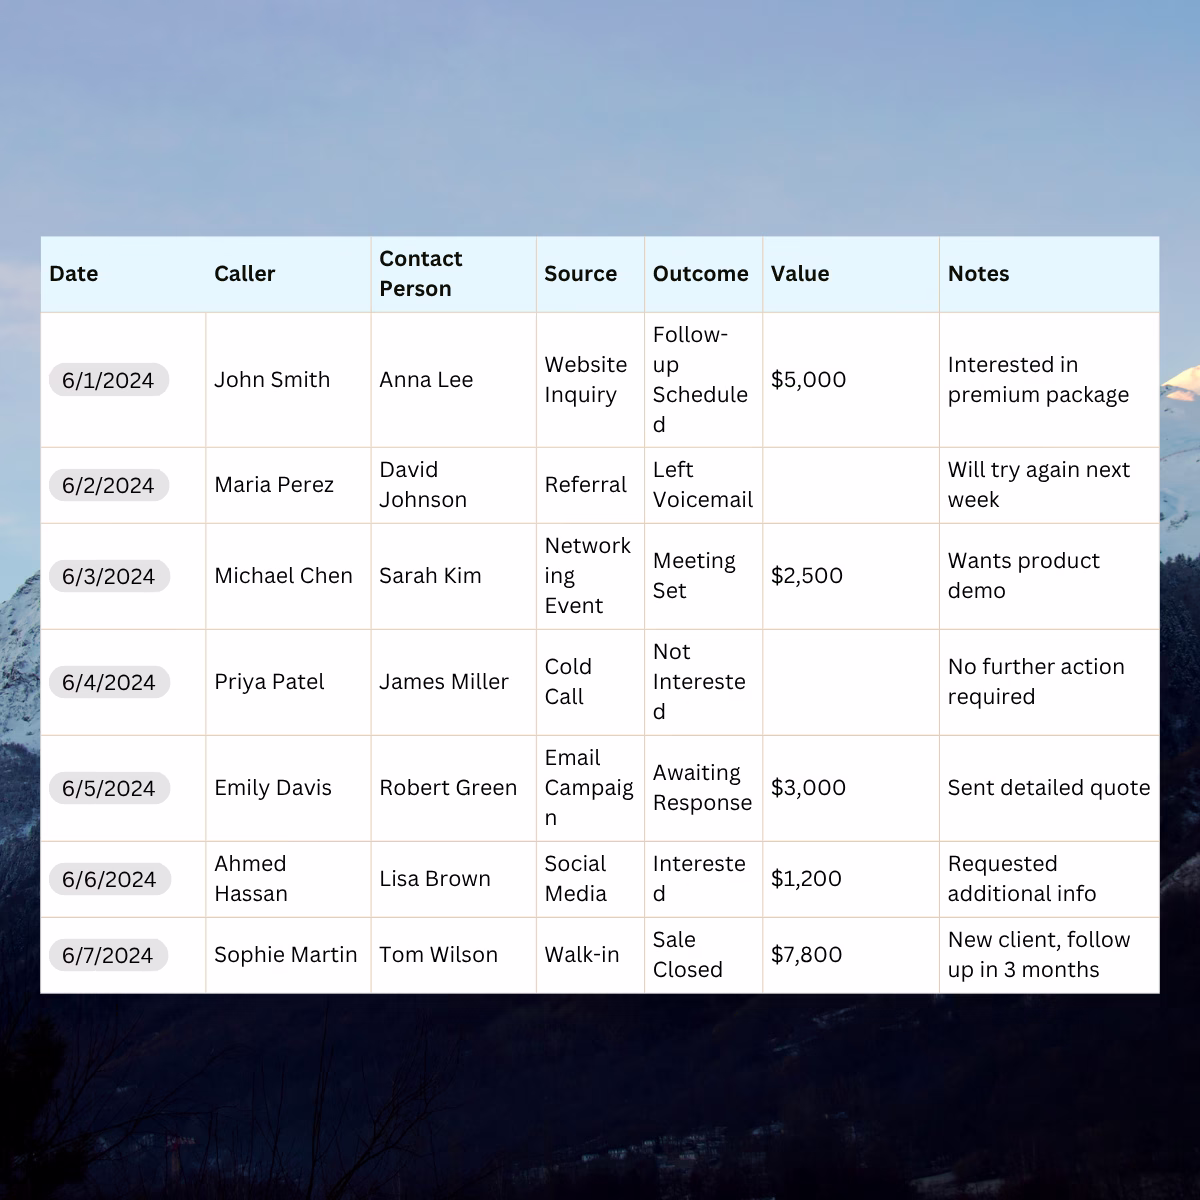
Method 3: Send call data to Google Sheets for custom analysis
Some teams need raw call data for deeper work or custom reporting. Nimbata and other call tracking platforms allow you to send calls directly into Google Sheets.
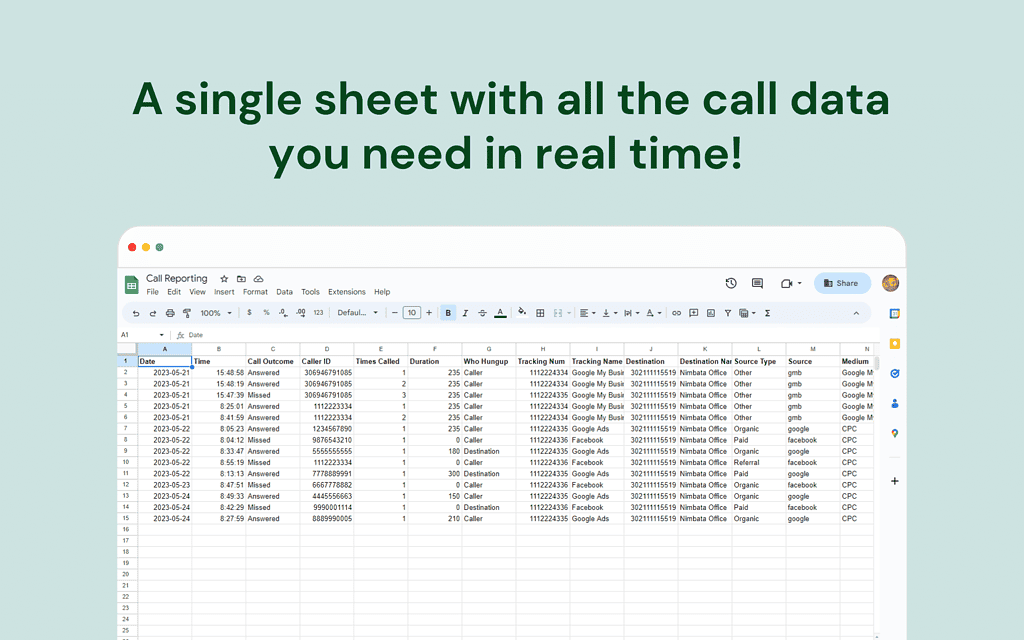
Advantages of using Google Sheets
- Full access to raw data
- Easy sharing with clients
- Ability to create custom pivot tables
- Useful for modeling or combining with other client data
- Flexible formatting and charting options
This method is especially useful for teams that prefer manual control or have unique reporting requirements.
Method 4: Use Webhooks to automate reporting into external tools
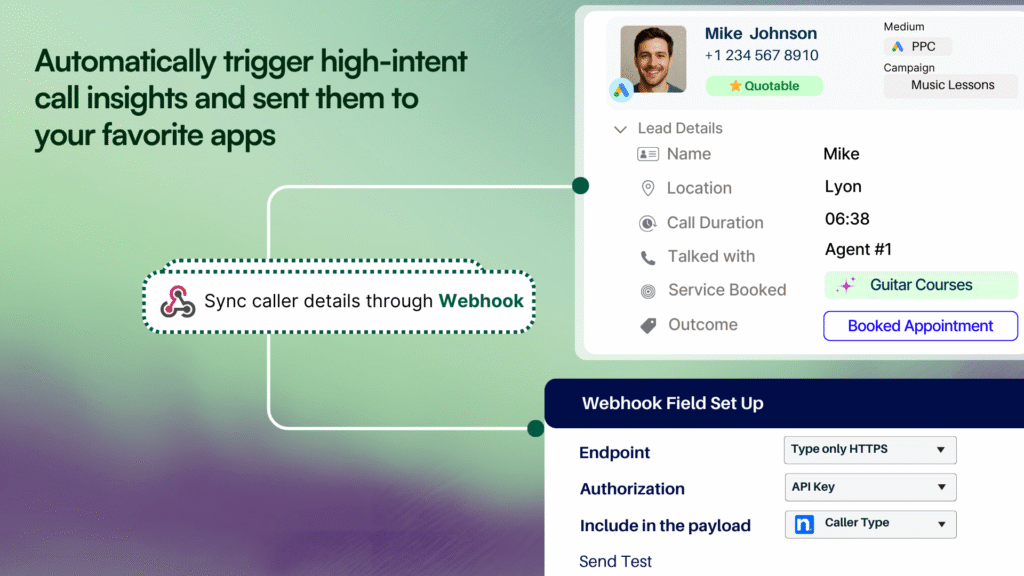
If you use CRMs, proprietary dashboards or third-party BI tools, you can automate call tracking metrics reporting through Webhooks, which send call data directly to a chosen endpoint.
Typical use cases
- Sending every new call to a CRM
- Sending call events to a reporting tool
- Creating internal dashboards that combine call and revenue data
- Automating updates to a client performance board
This method gives you flexibility and can streamline reporting significantly.
Method 5: Alternatively, use Zapier for external tool auto-reporting
Another way to automate call tracking metrics reporting is via Zapier, which connects your call tracking software to thousands of tools.
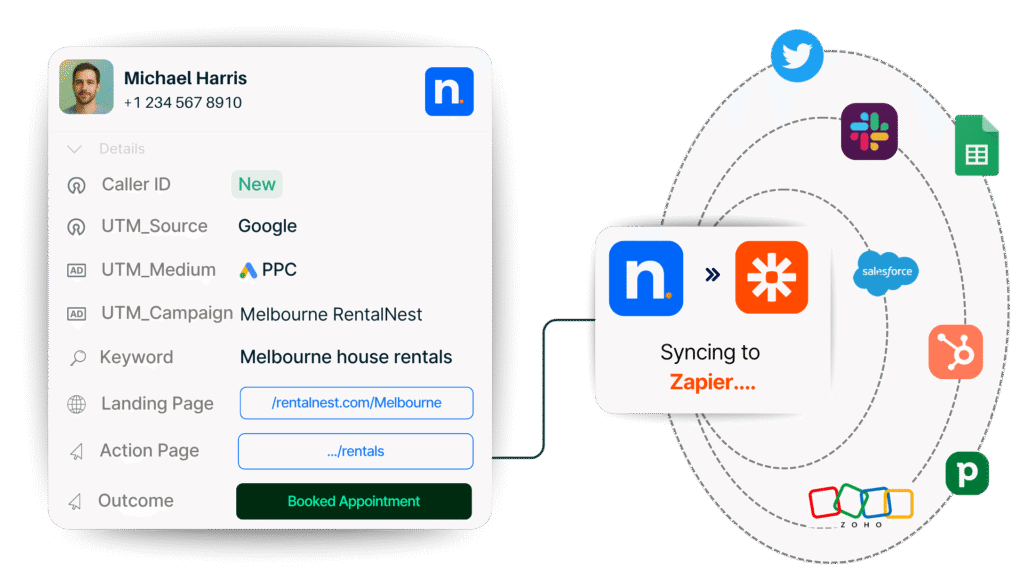
Typical use cases include the same ones as with Webhooks above.
Method 6: Use a hybrid workflow
Many agencies combine the methods above. For example:
- Use Nimbata’s dashboard for attribution and call insights
- Export call data into Sheets for pivot tables and deeper analysis
- Build a Looker Studio dashboard for client delivery
This lets you benefit from both native call tracking features and custom reporting environments.
Remember: When choosing the data source make sure that you are sending all the call information you want in Google Analytics 4.
Which call tracking metrics to include in your report
1. Call summary metrics
These are high level indicators that every call tracking metrics report should begin with.
- Total Calls
- Total Answered Calls
- Total Minutes
- Average Call Duration
- Unique Callers
- New Callers
These metrics give a snapshot of volume, engagement and caller diversity.
2. Calls by day
A breakdown of total calls per day helps you identify:
- Activity spikes
- Performance patterns
- Days with unusually low or high caller engagement
This is useful for adjusting budgets or staffing.
3. Calls by marketing source
This section is essential for call attribution reporting. It shows which marketing channels are driving calls.
Examples of sources include:
- Paid search
- Organic search
- Social media
- Email campaigns
- Offline campaigns
- Specific landing pages
This metric helps determine where to allocate budget.
4. Missed callers
According to your original article, missed callers are:
- Customers who called
- Did not reach an agent
- Did not call back
This list is important because it gives your client a chance to recover lost leads.
5. Average calls by hour and day
This KPI shows when callers are most active.
Clients can use this information to:
- Understand peak hours
- Adjust team schedules
- Ensure calls are handled promptly
- Time promotions more effectively
How to build a call tracking metrics report: Recommended framework
Below is a structured process based entirely on best practices:
Step 1: Choose a reporting method
Select one or more of the reporting methods discussed above, depending on:
- Client preferences
- Volume of data
- Complexity of analysis
- Presentation needs
Step 2: Collect and validate call data
Before reporting, ensure that:
- Tracking numbers are placed correctly
- Call data is flowing to GA4 or other tools if needed
- Session to phone tracking is active if you are using Nimbata
- Calls are being tagged or labeled where appropriate
Step 3: Select your KPIs
Include essential metrics such as:
- Call summary metrics
- Calls by day
- Calls by source
- Missed callers
- Time of day analysis
Only add additional metrics if they add value.
Step 4: Structure your report clearly
A good structure includes:
- Overview section
- Attribution section
- Caller behavior section
- Operational performance section
- Opportunity section such as missed calls
Step 5: Add visual elements
Charts and tables help clients understand data quickly. Useful visuals include:
- Line charts for call volume trends
- Bar charts for calls by source
- Heatmaps for calls by hour
- Tables for missed callers
Step 6: Automate data delivery when possible
Automation ensures scalability and accuracy. Options include:
- Sending calls to Sheets
- Using Zapier
- Using Webhooks
- Scheduling exports
Step 7: Deliver the report with insights
Always interpret the data for the client. This includes:
- Trends
- Opportunities
- Issues
- Recommendations
Clients appreciate guidance, not just raw numbers.
Takeaway
Call tracking metrics reporting is essential for understanding marketing effectiveness, improving operations and capturing missed opportunities. Whether you build your reports using Nimbata’s dashboard, Looker Studio, Google Sheets or automation tools, the key is to present clear and actionable metrics. By including the right KPIs and structuring your reports well, you create a reliable system that communicates value and supports better decision making.
FAQ: Call tracking metrics reporting
What is a call tracking metrics report?
A call tracking metrics report is a structured summary of phone call activity that shows key data such as total calls, answered calls, call duration, call sources, missed calls, and caller behavior. It helps businesses and agencies evaluate the performance of their marketing efforts and understand how well calls are being handled.
Why is call tracking important for marketing reporting?
Call tracking connects phone calls to specific marketing channels, campaigns, ads, or landing pages. This allows you to measure which marketing efforts generate phone leads, evaluate call quality, identify missed opportunities, and optimize budget allocation.
What should be included in a call tracking metrics report?
A complete report includes call summary metrics, calls by day, calls by source, missed callers, and call activity by hour. These metrics create a clear view of call performance, caller engagement, and marketing attribution.
How does call attribution reporting work?
Call attribution reporting uses tracking numbers or session to phone tracking to identify which marketing channels or campaigns influenced a phone call. The data is then combined in a report that shows which sources produce the best leads.
How does Nimbata support call tracking metrics reporting?
Nimbata supports reporting by offering session to phone tracking, call recording, transcription, call tagging, call outcome tracking, customizable dashboards, white label reports, and integrations with analytics tools and CRMs. These features help create accurate and actionable call tracking insights.
Can I automate call tracking metrics reporting?
Automation is possible by sending call data from your call tracking software to tools such as Google Analytics 4, Google Sheets, Looker Studio, CRMs, or BI platforms. This can be done through built in integrations, Zapier, or Webhooks.
How do I create a call tracking metrics report in Looker Studio?
You must first send your call data to Google Analytics 4. Once the data is available in GA4, you can select it as a data source inside Looker Studio and create charts, scorecards, and tables that visualize call performance.
What are the most important call tracking metrics to monitor?
The core metrics include total calls, answered calls, missed calls, total minutes, average call duration, unique callers, new callers, calls by source, calls by day, and calls by hour. These KPIs help measure marketing impact and operational performance.
How do missed calls affect my reporting?
Missed calls represent lost business opportunities. A call tracking metrics report should include a list of missed callers so your team can follow up. Monitoring missed calls also helps identify staffing issues or scheduling gaps.
Can call recordings and call transcriptions be used in reporting?
Call recordings and transcriptions offer qualitative data that reveals customer intent, lead quality, and conversation outcomes. These insights add depth to your call analytics report and help clients understand more than just volume based metrics.
Can I combine call data with website or advertising data?
You can send call data to GA4 or BI tools to combine it with website traffic, conversions, and advertising metrics. This helps create a complete marketing performance report that includes both online and phone lead reporting.
What types of businesses benefit most from call tracking?
Any business that relies on phone inquiries benefits from call tracking. This includes service businesses, local businesses, healthcare, legal services, real estate, automotive, home services, and agencies that manage phone driven lead generation campaigns.
What is the difference between call tracking metrics and call analytics?
Call tracking metrics focus on what happened, for example call counts, call sources, and call durations. Call analytics examines why it happened and how well calls performed, including insights from call outcomes, recordings, transcriptions, and caller patterns.
How often should I update my call tracking metrics report?
Most agencies update call tracking metrics reporting weekly or monthly, but the right frequency depends on call volume, campaign activity, and how often clients need performance insights.
Can I white label call tracking reports for clients?
Yes. Nimbata offers white label dashboards and exportable reports that can be branded with your agency’s colors, logo, and terminology. This makes reporting more professional and client friendly.