A sales call tracking template is a spreadsheet for logging your calls in one consistent format. The template below captures 16 fields per call, produces seven dashboard metrics, and works in Google Sheets. It also tells you the exact volume where it stops being useful.
Most sales teams track phone calls badly. They log them in three different places — a Slack DM, a CRM field, the rep’s notebook — with three different naming conventions, and by week two the data is too messy to do anything with. A sales call tracking template doesn’t make the calls better. It makes the data usable. One format, one dashboard, one place every rep drops their calls.
The template below is free, works in Google Sheets, and gives you the same 16 fields and seven dashboard metrics that mature call tracking platforms capture by default. We’ve called out what works and what doesn’t, including the volume at which a spreadsheet stops earning its keep.
Download
- Open in Google Sheets → GSheet – Nimbata Call Tracking Template
What is a sales call tracking template
A call tracking template is a ready-made structure for logging phone calls — who called, where they came from, what happened on the call, and what the call was worth. It usually includes fields for date, time, caller, phone number, source, campaign, duration, outcome, lead score, estimated value, notes, next step, and status.
The right template depends on three things:
- Call volume: Are you logging 10 calls a week, or 100?
- What you’re tracking: Marketing attribution, sales conversion, support handle time, or compliance recordkeeping?
- Who’s using it: A solo SDR, a small inbound team, or an agency reporting to multiple clients?
A solo SDR tracking 30 outbound calls a week may only need a basic log with source, outcome, and notes. A five-person inbound team running paid ads needs source attribution, lead scoring, pipeline value, and a dashboard that compares channels by win rate.
What’s in the template
Nimbata’s free sales call tracking template is a single workbook with four tabs:
| Tab | What it does |
|---|---|
| Start Here | Quick instructions, glossary of fields, when to graduate to software |
| Call Tracking | The actual data entry sheet. Log every call here, one row at a time |
| Dashboard | Auto-calculated KPIs and breakdowns; updates as you log calls |
| Lists | Lookup values for the dropdowns; edit to add your own sources or outcomes |
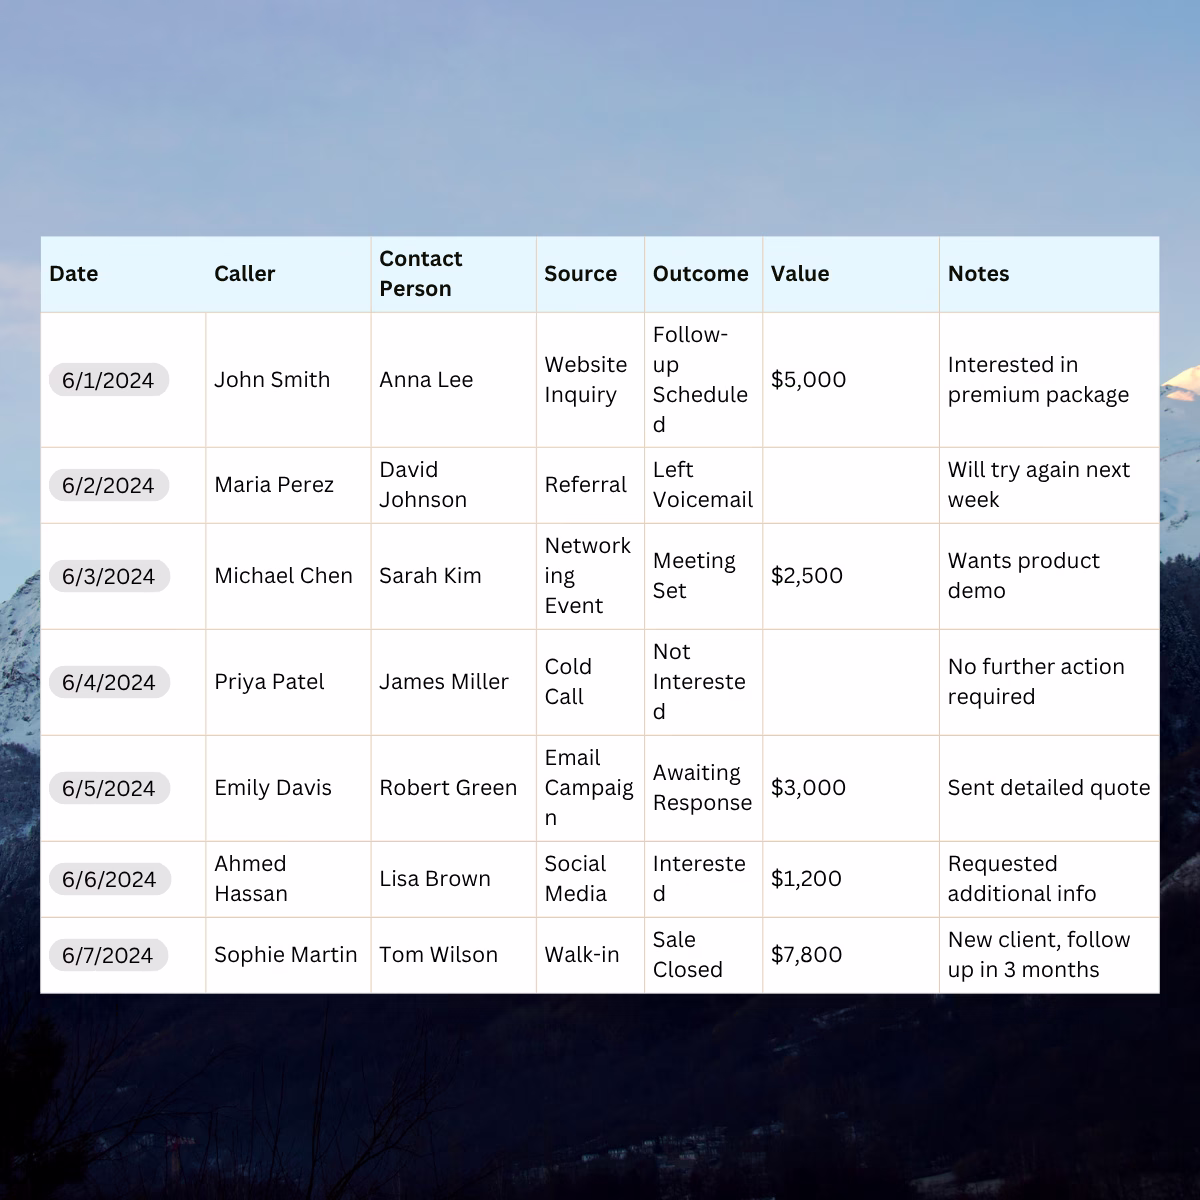
Call Tracking Tab
The Call Tracking tab, your call log template, has 16 columns covering the full call lifecycle:
- Date: when the call happened
- Time: when it started
- Caller / Contact: name of the person you spoke to
- Phone Number: their number
- Company: their organization
- Source (dropdown): where the call originated (Google Ads, Organic, Referral, etc.)
- Campaign: the specific campaign, ad, or keyword (if known)
- Type (dropdown): Inbound or Outbound
- Duration (min): how long the call lasted
- Outcome (dropdown) — what happened on the call (Qualified, Booked, Sold, Follow-up Needed, Unqualified, etc.)
- Lead Score (1–5) (dropdown): your read on lead quality
- Est. Value ($): the rough dollar value of the opportunity
- Notes: short summary of the conversation
- Next Step: what you committed to do
- Next Contact Date: when you’ll follow up
- Status (dropdown): Open, Won, Lost, or On Hold
Five fields (Source, Type, Outcome, Lead Score, Status) use dropdown menus. Dropdowns enforce consistent values, which prevents the same source from being recorded as “Google Ads,” “google ads,” and “GoogleAds” in different rows, a common cause of inaccurate dashboard data.
Dashboard Tab
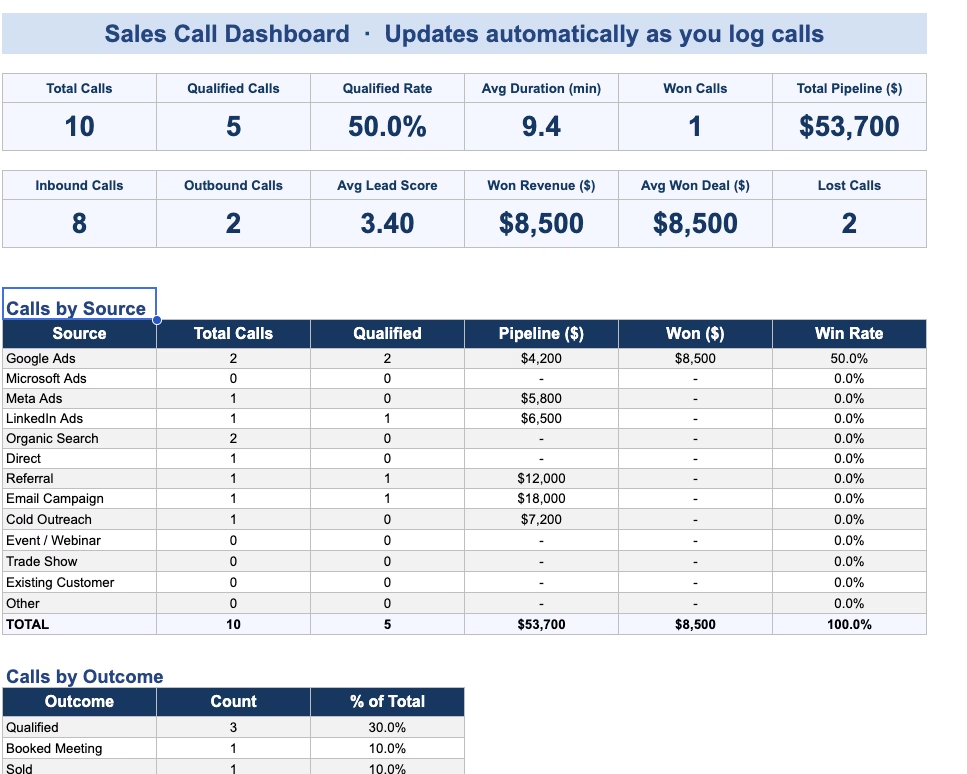
The 7 call metrics the dashboard calculates
The Dashboard reads the Call Tracking and rolls it up. Seven KPIs at the top:
| Metric | What it means |
|---|---|
| Total calls | Activity. Useful for benchmarking, useless on its own. |
| Qualified calls | Calls tagged Qualified, Booked Meeting, or Sold. |
| Qualified rate | The most actionable number on the page. Under 30% means your sources are wrong, your reps are wrong, or both. |
| Average duration | Long calls usually mean real conversations. Sub-2-minute averages usually mean spam. |
| Won calls | Anything with Status = Won. |
| Total pipeline ($) | Sum of Est. Value across Open calls. Your forecast. |
| Won revenue ($) | Sum of Est. Value across Won calls. The number you put in the monthly report. |
Below the KPIs you get a Calls by Source breakdown (pipeline and win rate per channel) and a Calls by Outcome breakdown (count and percentage of total). Both update live.source (with pipeline and win rate per source) and by outcome (with percentage of total). The full breakdown updates automatically.
How to use the template {step by step}
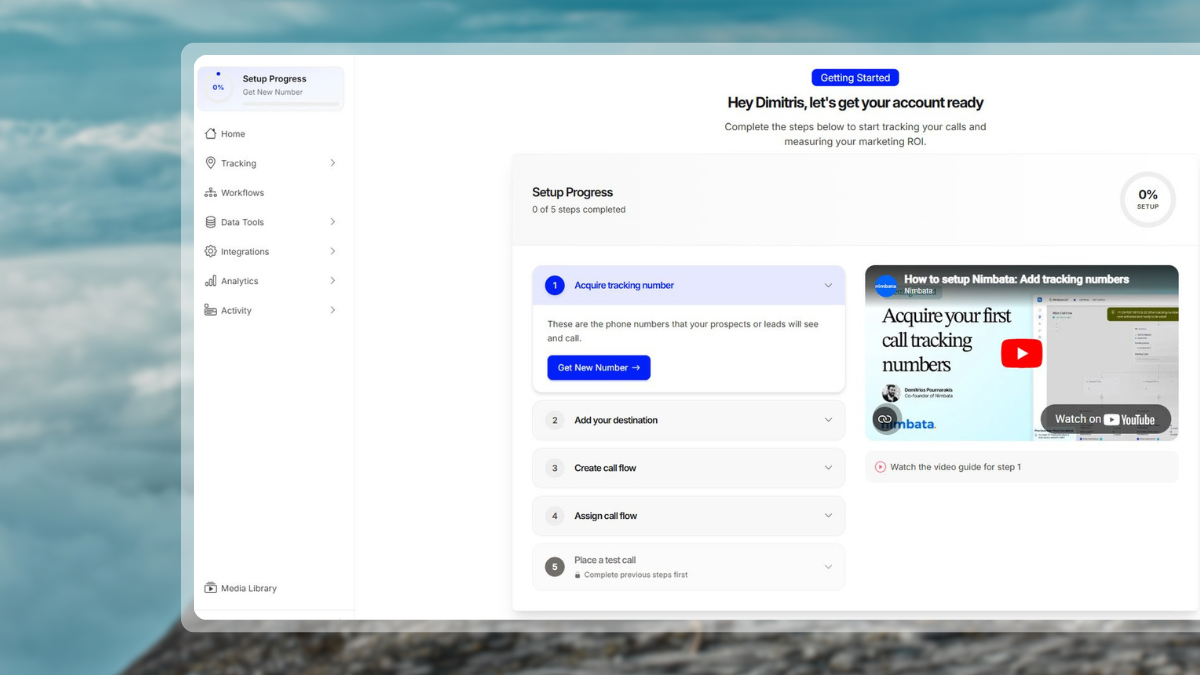
Step 1. Download and duplicate
In Google Sheets, click File → Make a copy to save it to your own Drive.
Step 2. Replace the sample rows
The template ships with ten sample rows so you can see how it works. Once you understand the structure, delete those rows (don’t delete the headers) and start logging your own calls.
Step 3. Use the dropdowns
In the Source, Type, Outcome, Lead Score, and Status columns, click the cell and a dropdown arrow appears. Pick from the list, don’t type freehand. This keeps the data consistent so the dashboard can count it correctly.
Step 4. Customize the lookup lists
If your business has sources or outcomes the template doesn’t include, open the Lists tab and add them. The dropdowns will update automatically.
Step 5. Log every call, every day
The template is only as useful as the data you put in it. Log calls in real time or in a single 5-minute end-of-day batch. Don’t let calls pile up for a week — the longer you wait, the less accurate the notes.
Step 6. Review the dashboard weekly
Once a week, open the Dashboard tab and look at three things: (1) your qualified rate, (2) your top source by win rate, and (3) your open pipeline. Those three numbers will tell you most of what you need to know.
Step 7. Share with your team
If multiple reps are using the same template, use the Google Sheets version and share it with edit permissions. The dashboard rolls up all calls from all reps automatically.
Common use cases
The template is used across a range of sales contexts. Three representative examples:
Outbound SDR teams. SDRs running structured outreach sequences use the template to track outbound activity by campaign. Logging each call with Source set to Cold Outreach and Campaign set to the sequence name allows the dashboard to surface which sequences produce qualified conversations and which do not.
Inbound teams running paid media. Teams receiving inbound calls from paid search and paid social use the template to attribute calls to specific channels. Each call is logged with Source set to the originating platform. After 30 days of data, the Calls by Source breakdown shows cost-per-qualified-call by channel.
Agencies tracking calls for a single client. Agencies use one template per client to log calls and produce monthly reports. The Won Revenue figure feeds the client ROI calculation, and the Calls by Source table informs budget allocation discussions.
Limitations of spreadsheet-based call tracking
Spreadsheet logging has known limitations that become more apparent as call volume increases.
Manual source attribution is approximate. Without dynamic number insertion, a technique that assigns a unique phone number to each visitor and captures attribution automatically when the call connects, the Source field relies on either the caller’s self-report or the rep’s inference. Both are unreliable at scale.
Missed calls are not captured. A spreadsheet only records calls that a person remembered to log. Missed inbound calls, calls during off-hours, and calls that hit voicemail are not represented in the data unless a rep manually adds them. Industry research suggests 35–45% of missed inbound calls go to a competitor within 30 minutes if not followed up.
Conversation-level data is unavailable. The Notes field captures whatever the rep chose to write, typically a sentence or two. Full conversation data, including recording, transcription, sentiment, and AI-detected intent, is not available in a spreadsheet workflow.
These limitations are characteristic of any manual tracking system. They tend to become material at volumes above approximately 50 calls per week per rep, and at paid-media spend levels above approximately $5,000 per month, where attribution accuracy directly affects budget decisions.
Migration to dedicated call tracking software
The standard upgrade path from a spreadsheet template is dedicated call tracking software rather than a CRM. The two categories address different problems: CRMs track contacts and deals across many touchpoints; call tracking software captures call-level data – including source attribution, recording, transcription, and outcome – that CRMs typically do not collect natively.
Call tracking platforms generally provide the same data fields as the template above, with three additions that spreadsheets cannot reproduce: automatic source attribution via dynamic number insertion, automatic call recording and transcription, and AI-based outcome and sentiment tagging. Reports and dashboards in dedicated tools are typically real-time and exportable to GA4, Looker Studio, and most CRMs.
Common triggers for migration include:
| Trigger | Reason |
|---|---|
| Call volume above 50 per week per rep | Manual logging accuracy declines |
| Paid media spend above $3,000/month | Source attribution accuracy becomes financially material |
| Agency managing 2+ clients | Multiple spreadsheets become harder to maintain than white-label software |
FAQ – Call Tracking Template
Yes. The Type field has a dropdown for Inbound or Outbound, and the dashboard counts each separately. Most teams use a single template for both call types rather than maintaining two files.
Five metrics are commonly considered foundational: total calls, qualified call rate, average duration, total pipeline value, and win rate by source. The template’s dashboard surfaces all five automatically. Additional metrics such as average lead score and win rate by rep are useful once a few weeks of data has accumulated.
Common triggers include call volume above approximately 50 per week per rep, paid media spend above approximately $5,000 per month (where source attribution becomes financially material), and any agency context requiring white-label client reporting. At these thresholds, the data quality from manual logging usually becomes a constraint on decision-making.
Further reading
For a foundational definition of the category and how call tracking works in practice, see What is call tracking? For an overview of how call tracking reporting is structured beyond the spreadsheet stage, see What is call tracking reporting? For a step-by-step guide to building call tracking reports at scale, see How to build a call tracking metrics report. For a comparison of the leading call tracking platforms, see The best call tracking software compared.